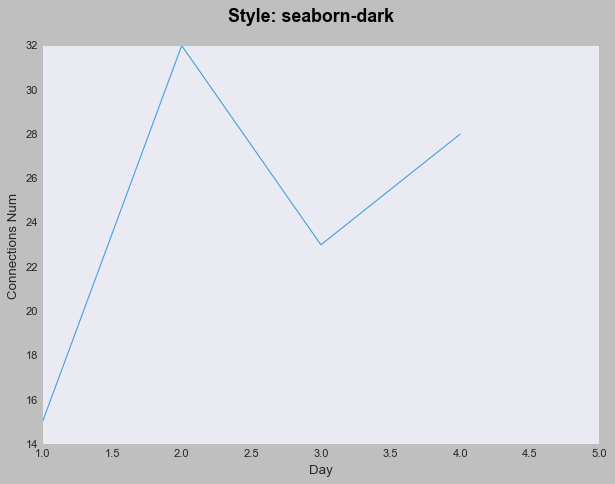
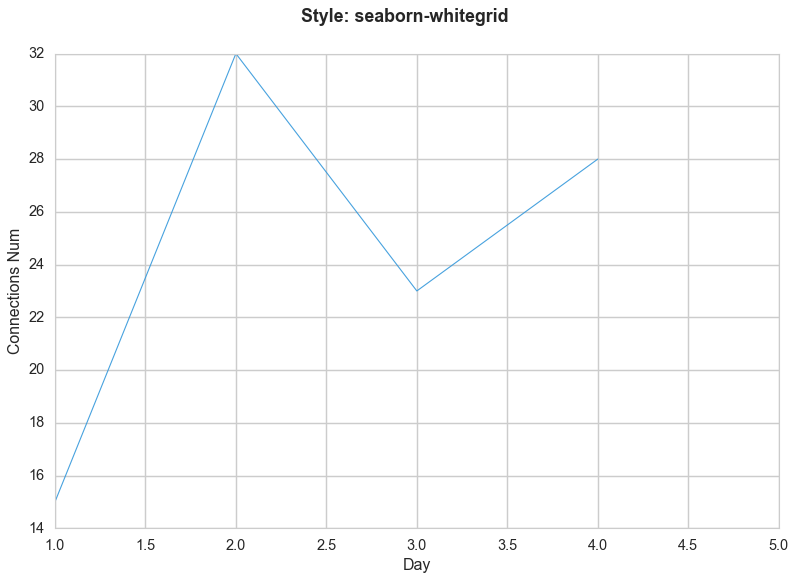
def draw(data):
    x = range(len(data))
    y = [data[d] for d in data]
    z = zip(x, y)

    styles = plt.style.available
    print(styles)

    for s in styles:
        plt.suptitle('Style: %s'%s, fontsize=16, fontweight='bold')
        plt.style.use(s) # 设置使用的样式
        plt.plot(x, y, color='#3498DB', linewidth=1, alpha=0.9)
        plt.xlim(1, len(data))  # 限定X轴范围
        ax = plt.axes()
        plt.xlabel('Day')
        plt.ylabel('Connections Num')
        plt.show()
data的数据格式:
{0: 19, 1: 15, 2: 32, 3: 23, 4: 28}


